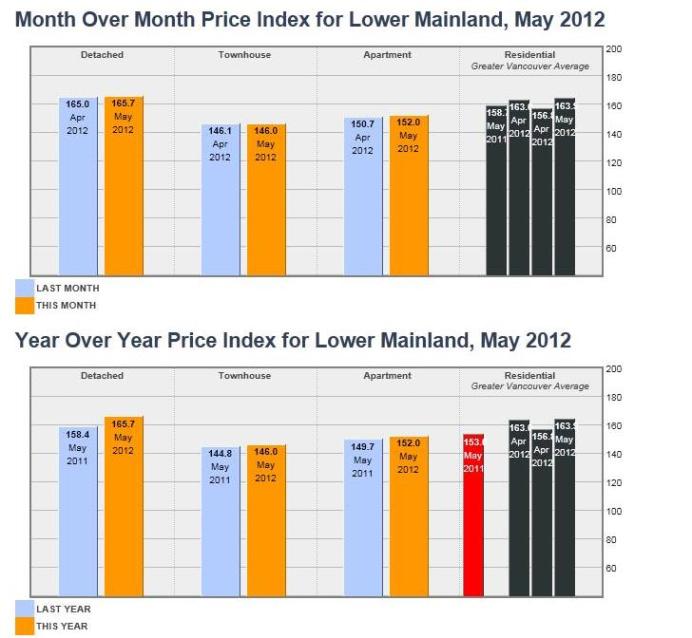
Home Price Index for Lower Mainland, May 2012
| Benchmark ▲▼ | Price Index ▲▼ | 1 Month +/- ▲▼ | 6 Month +/- ▲▼ | 1 Year +/- ▲▼ | 3 Year +/- ▲▼ | 5 Year +/- ▲▼ | |
|---|---|---|---|---|---|---|---|
Residential (Greater Vancouver Average) |
|||||||
| $625,100 | 163.9 | 0.6 | 3.0 | 3.3 | 24.0 | 20.1 | |
| $558,300 | 157.6 | 0.5 | 2.8 | 3.0 | 20.3 | 15.3 | |
Detached |
|||||||
| $779,800 | 165.7 | 0.4 | 3.0 | 4.6 | 29.3 | 23.1 | |
Townhouse |
|||||||
| $402,200 | 146.0 | -0.1 | 1.2 | 0.8 | 13.1 | 9.2 | |
Apartment |
|||||||
| $346,500 | 152.0 | 0.9 | 3.1 | 1.5 | 12.1 | 7.8 | |
How To Read The Table:
- BENCHMARK PRICE:
- Estimated sale price of a benchmark property. Benchmarks represent a typical property within each market.
<!–PRICE RANGE:Expresed as a + or – percentage of the benchmark price, there is a 90% probability the sale price of a benchmark house is within the interval.
–>PRICE INDEX:Index numbers estimate the percentage change in price on typical and constant quality properties over time. All figures are based on past sales.In January 2005, the index = 100Key:* = Sales sample too small; Price information not reported.
The above info is deemed reliable, but is not guaranteed. All dollar amounts in CDN.
For all your premium real estate services,, please contact Maria Mak and her team at Sutton Centre Realty at 604-839-6368 or visit her website www.mariamak.com, You will be smiling too!

